
This week Gower Street has introduced a key new feature to our Road To Recovery reports: Growth Trackers by international market and US state/Canadian province.
The re-opening of traditional cinemas and surge in the drive-in sector in many states and some international markets has brought much needed positive news. As the number of cinemas re-opening continues to grow and they, in-turn, grow their audience, it is vital that the industry is able to track that growth over time. This will not only provide clarity on what is actually being achieved and help guide those following, but will also provide crucial information for the future should other crises arise.
These donut graphs measure the progress towards each of the 5 identified stages of our Blueprint To Recovery. We have previously outlined the stages, announced key markers for each market, and explained the maths behind them. With these market growth trackers we will enable individual markets or states to measure their own growth as well as identify others that might provide planning guidance.
So, how do they work?
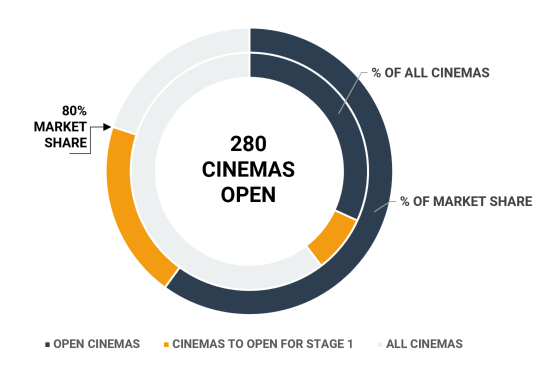
The sample donut graph below explains the displayed information for stage 1, which looks at cinemas open. The outer edge measures normal market share of the theaters currently open (in blue) and progress toward the 80% requirement (orange) to hit the stage 1 target. The grey is the remaining 20%. The inner edge measures the actual number of open theaters. Here the blue section is theaters reporting; orange is minimum number of theaters required to hit 80% market share in a normal year; grey is total number of theaters in the market.
The stage 2-5 donuts measure box office goals. The donut hole shows the day (stage 2) or week (stages 3-5) goals alongside the result for the current day or week and the percentage of the target reached. The outer edge of the donut shows the current day or week percentage result. The inner edge shows the best day or week result so far since re-opening. This is useful in seeing any regression as well as improvement. Results are shown in blue with the remaining orange section of the donut showing the percentage remaining to reach the goal.
The progress made in the current week (or in the case of stage 2, latest day) towards the goal is displayed within the donut hole. If the stage-goal has been reached on a previous day or week since recovery began then the date this first occurred is identified.
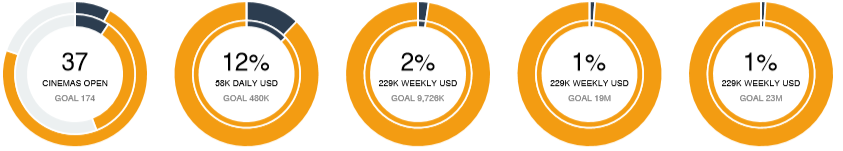
Looking at the below example for Germany we can see the following:
Germany:
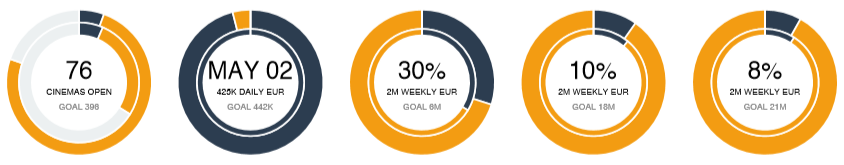
Stage 1 (Open day): 76 cinemas reported data to Comscore. It would take, at minimum, the top-grossing 398 cinemas from the past two years to delivering 80% market share by box office.
Stage 2 (Base day): The individual day goal was not reached for the latest day measured (the outer edge of the donut). However, the goal has been reached on a previous day since recovery began (the inside edge). The date the goal was first achieved is displayed in the donut hole. When the outer edge is also 100% blue for a later date there will be evidence of box office consistency.
Stage 3 (Base week): The latest week’s box office achieved 30% of the goal (to reach the lowest week’s box office from the past two years). A previous week is shown to have come marginally closer.
Stage 4 (Material week): The latest week’s box office achieved 10% of the goal (to achieve a median level of the weekly business seen across the past two years).
Stage 5 (Recovery week): The latest week’s box office achieved 8% of the goral (to reach an equivalent performance to those in the top quartile of weekly business in the past two years).
We can see how Germany’s latest results contrast to those of Japan, where re-openings are only just starting to occur:
Japan:
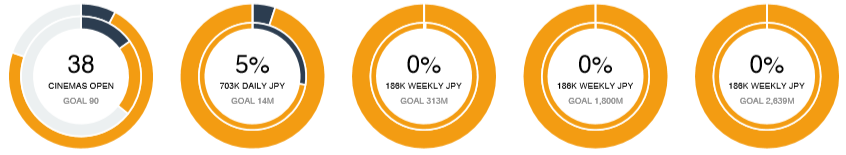
One contrast is seen on the stage 2 tracker. In Japan the goal has yet to achieved. As a result, the percentage of the goal reached is shown in the donut hole.
The below examples contrast results from two of the early US States to allow the re-opening of traditional cinemas: Georgia and Texas. While Texas has more actual sites playing, Georgia has achieved greater proportions of box office goals on its Blueprint To Recovery. Texas is the second biggest box office state in the US behind California and normally generates more than three times the annual box office of Georgia.
Georgia:
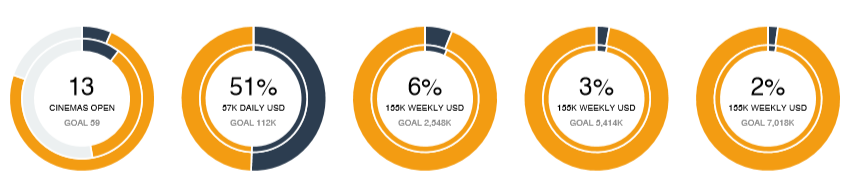
Texas:
Each week these Growth Trackers will show the progress being made around the world as more markets re-open and bring audiences back. Following them each week will demonstrate growth achieved. Following them over time will provide valuable information about the duration taken between the achievement of each stage. This may provide a roadmap for others to follow.
These Growth Trackers are now available for each US state and Canadian province, as well as for the Domestic market as a whole, in our Domestic Road To Recovery report. Growth Trackers for each international market are now available in our International Road To Recovery report. We our now have individual reports available for key international markets including: UK/Ireland, France, Germany, Spain, Australia, Japan, South Korea and Mexico.
All Gower Street Road To Recovery reports are available from our Reports page.
If you have any questions or comments about Gower Street’s reports and articles please Contact Us.