
In an article recently published by Gower Street, we showed that $2.6 billion in Domestic box office was taken beyond Day 17 of release in 2019. Thus, had a 17-day window been in place, nearly a quarter (24%) of the year’s total box office ($11bn) might have been in question. To shed more light on the topic of windowing, Gower Street is exploring this theme further. Looking at the seasonality of box office achieved post Day 17 of release in this edition.
The time frame of the exclusive theatrical window has been a focal point of conflict between exhibition and the studios for over 70 years. With the rise of streaming services and digital distribution over the last decade, it has intensified. The resulting shutdown of movie theatres due to the COVID-19 crisis has only stoked the fires further. This most recently culminated in a deal between AMC Theatres and Universal that would allow Universal to release their titles on PVOD after just 17 days in cinemas. A significant shift down from the traditional 90-day window. This agreement currently only covers the US, but a potential international rollout is planned to be discussed.
Utilising data from our partners at Comscore, we can determine that a median of $2.7 billion Domestic box office was generated after Day 17 in each of the last three years (2017 to 2019). This represents nearly a quarter (24%) of the median year’s total box office ($11.2bn). Our dataset specifically considers English language titles released between 2017 to 2019 with a lifetime box office over $1 million.
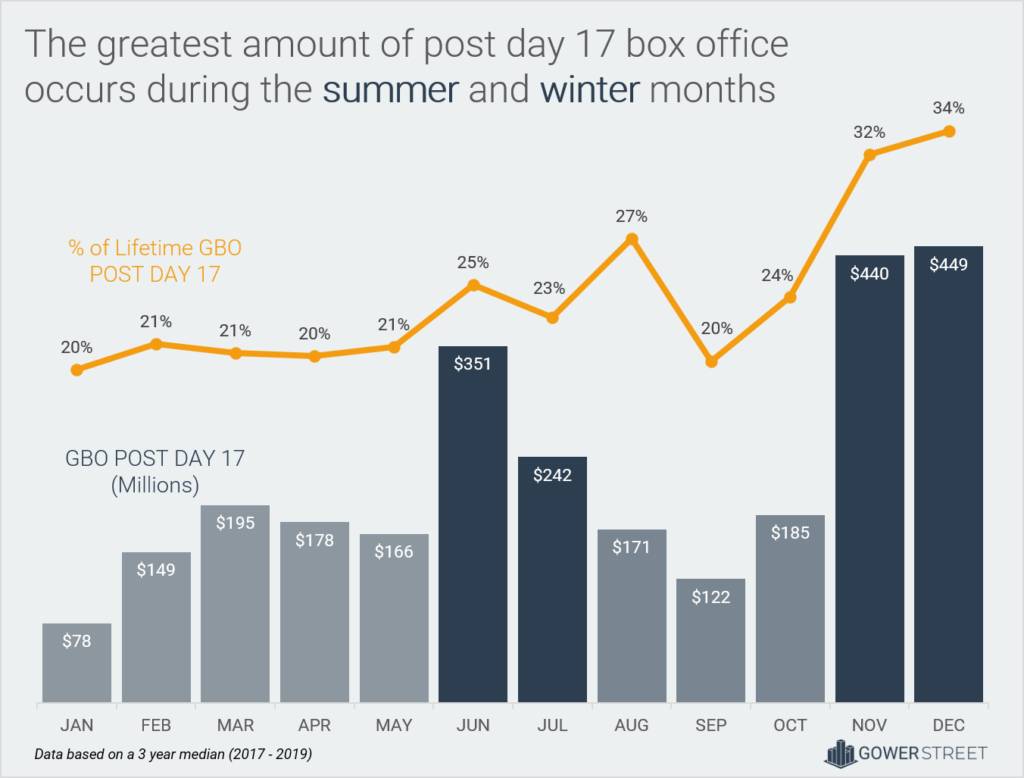
Individual title playouts differ depending on many variables. The seasonality in theatrical business is an essential one. The graphic below displays the three-year median GBO achieved post-Day 17 of the run (light and dark blue bars) for the releases of every month. Moreover, it shows the corresponding percentage of lifetime box office that was generated post-Day 17 of release for these titles (orange line).
Holidays Are Coming
December and November are the two stand-out months. Titles released in these two months took over $440 million each beyond Day 17, a combined median total of $889k. This is one third of the yearly median of $2.7 billion. The relative playout of titles released in these two months was also significantly higher than the rest of the year. Lifetime box office taken after Day 17 in November and December was 32% and 34% respectively.
One main factor is the titles themselves. Oscar contenders are often released in winter months, beginning with a limited release. In these cases, a large proportion of the box office falls outside of the 17-day window. Titles like THE SHAPE OF WATER ($60m, 94% of its lifetime GBO) and LADY BIRD ($44m, 90% of its lifetime GBO) emphasise this long tail.
Mid and Wide upscale releases also share this trend due to their older skewing audience. WONDER ($44m, 33% of its lifetime GBO) and THE MULE ($38m, 37% of its lifetime GBO) are just two examples.
Music-driven titles also found success at the end of the year with THE GREATEST SHOWMAN ($101m, 58% of lifetime gross) and BOHEMIAN RHAPSODY ($86m, 40% of its lifetime GBO).
These titles combined drew roughly half of the post-Day 17 GBO in November and December. The other half is mostly holiday driven product. For example, family animation films like COCO ($79m, 38% of its lifetime GBO), and live action comedies like DADDY’S HOME 2 ($30m, 29% of its lifetime GBO), which have extended play through the holiday season.
The Summer Season
Aside from November and December, the two most lucrative post-Day 17 months are June and July. Titles released in these two months took a combined median total of $593k beyond Day 17. $351 million in June and $242 million in July. This is over 20% of the yearly median of $2.7 billion. The proportion of lifetime box office taken after Day 17 in June and July is 25% and 23% respectively.
The two summer months are defined by tentpole releases. Action titles like WONDER WOMAN ($131m, 32% of its lifetime GBO) and MISSION: IMPOSSIBLE – FALLOUT ($56m, 26% of its lifetime GBO) are the main factor. The other contributor to this period is family titles playing through the long school holidays like TOY STORY 4 ($122m, 28% of its lifetime GBO), and HOTEL TRANSYLVANIA 3 ($46m, 28% of its lifetime GBO).
The Rest of the Pack
The median monthly box office after Day 17 in all other months was significantly lower – Under $200m in each. The proportion of lifetime box office after Day 17 is 20% or 21% for six of these eight months. One stand-out month in that context is August. Titles released in August take a median 27% of their lifetime after Day 17. Playing through a less competitive September supports the longer tail. Two examples are CRAZY RICH ASIANS (41% of its lifetime GBO) and THE MEG (26% of its lifetime GBO). The other outlier is October, in which titles have a median of 24%. The first award contenders start to release here, the main contributing factor.
The Exception to the Rule
In the right complementary competitive environment, at any time of the year, a movie that has the fitting potential can succeed with the support of a long tail. For example, a few horror-skewed titles, a genre that usually has a rather short playout (a median of 17% of lifetime GBO), were able to break out and do significant business after Day 17. In January 2017, SPLIT grossed $39m (28% of its lifetime GBO) past the cut-off. Even more successful was GET OUT ($63m, 36% of its lifetime GBO) a month later. A QUIET PLACE ($54m, 29% of its lifetime GBO) was another example.
Seasonality is shaped by consumer demand differing between months, and by distributors decisions. It can change, when defining parameters alter. In a time when deals like the one between AMC and Universal look to reduce the exclusive theatrical window, release date decisions become more vital than ever. It needs to be decided on each individual title’s potential and playout pattern in order to determine how to release it. As shown above, a yearly theatrical box office of $2.7 billion could be at stake.
For now, this analysis deals with knowns, not unknowns. Complex behavioural shifts, because of a possible change in length of the theatrical window, have not been considered yet. Consequently, we will be publishing further research in this area of windowing across more markets and regions in the coming weeks.
This article was originally published in Screendollars’ newsletter #134 (September 14, 2020).