
Three weeks ago Gower Street laid out its proposed benchmarks for a “Blueprint to Recovery” – the markers that would need to be achieved to indicate that the theatrical movie business was progressing in its recovery from the current crisis. Since first publishing the article we have received many questions about what levels of theaters-open or box office achieved would indicate a marker had been passed. As theaters re-open and audiences return we will all need greater clarity on how to assess how our business is progressing.
This is the first time we are all facing a challenge on this scale. There are no comparisons to easily draw from, but there is data and data, to quote Arturo Guillen, SVP and Global Managing Director of Comscore Movie Division, is “the basis to define reality.”
Based on the 5-key stages we laid out, Gower Street has identified these markers on a market-by-market and, for domestic, state-by-state basis. We will be introducing these in our “Road to Recovery” report published twice weekly.
However, we were keen to share some of this information with Screendollars’ readers early to provide top-line markers for the US and Canada.
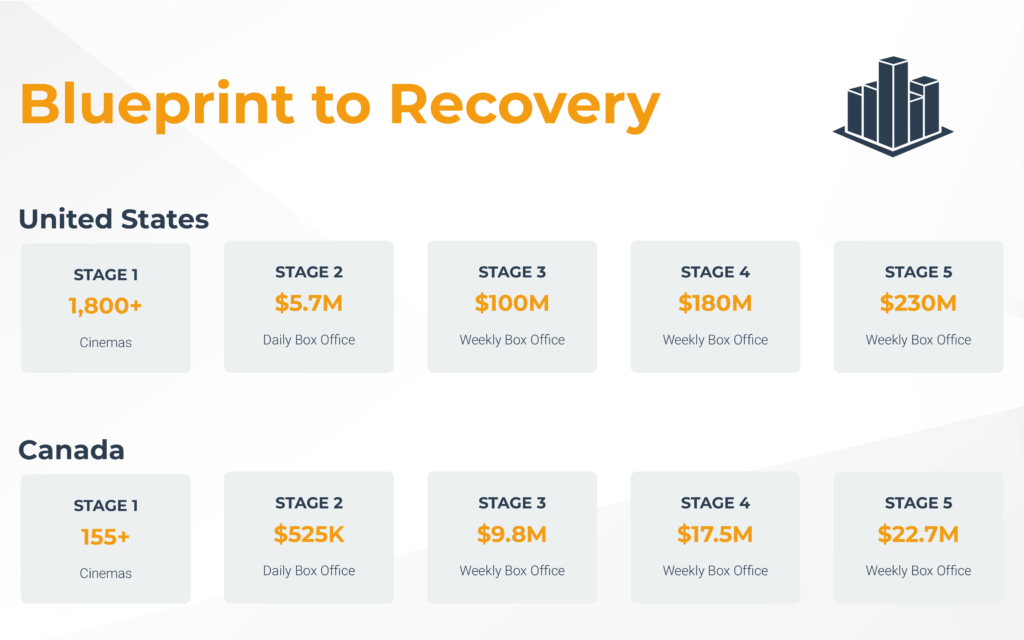
The “Blueprint to Recovery” identified 5-key stages with the first, “Open Day”, being a foundation point where a majority of theaters by market share would be open. We had suggested this should be 80% of market share. So the question that needs to be answered is: what would be the least number of theaters operating in a market, country, city, etc. that could achieve an 80% market share?
Let’s consider the two major countries of the domestic market: the US and Canada. For each of the five stages we based our data on the past two years: 2018 and 2019. In the US the smallest number of theaters capable of delivering 80% of market share is 1,816 – this represents roughly 31% of physical cinemas. A similar percentage of actual sites could generate 80% market share in Australia but in the UK it would take around 40% (349 sites). In Canada an 80% market share could be achieved from the top earning 159 theaters.
These are not just any 1,816 US theaters but the top grossers from the past two years: cinemas from the AMC’s Burbank 16 and Empire 25 locations in California and New York, respectively, through to the Violet Crown in Charlottesville, Virginia and Regal’s Colorado Center 8 in Denver. Were Regal cinemas to delay the opening of their circuit for any reason the US market would need a minimum of 3,645 other theaters open to achieve an 80% market share without them. Such a marker would be impossible to achieve if all AMC theaters remained closed.
Just as states have closed down at different rates, each state and city would equally have its own markers for recovery. States that lag behind would also impact countrywide recovery. The continued closure of any one of the 50 US states would not prevent “Open Day” from being achievable. Were California to be the last state to re-open an 80% market share could still be achieved by 3,093 theaters from other states. If New York were last to re-open it would need only 2,055 of top theaters open in other states; without Texas it would take 2,217.
If California and Texas, the two biggest box office states, were both completely closed an 80% market share would not be achievable. The same would be true if California and any one of Florida, New York, Illinois, Georgia, New Jersey, Arizona, Pennsylvania, Virginia, Washington, Ohio, Michigan or North Carolina remained completely closed. If Florida and New York both remained closed an 80% market share could still be achieved by a minimum of the top 2,490 theaters from across the remaining states. If the 21 highest grossing states were all completely open it would be possible to achieve an 80% market share without any contribution from the remaining 29 and the District of Columbia.
There are numerous ways to slice the data and it is certain, as we have seen with the shutdown, that it will not be as simple as a state being entirely open or closed. Instead contributions will start to come in from individual theaters across all states at different times. Based on the past two years data Gower Street has been able to assign market share to each theater and we will track each state’s progress towards achieving “Open Day”, as well as on market and country levels.
Once 80% of theatres by market share are operational, how do we identify that audiences are returning is great enough numbers to indicate a recovery? For this we laid out four further markers:
- “Base Day” – the first day of operation in which box office reaches the lowest day’s box office result from the past two years.
- “Base Week” – the first full-week of operation in which box office reaches the lowest week’s box office result from the past two years.
- “Material Week” – the first full-week to achieve a median level of the weekly business seen across the past two years.
- “Recovery Week” – the first full-week to achieve an equivalent performance to those in the top quartile of weekly business in the past two years.
So, what are the exact levels these represent?
Let’s again consider the US and Canada separately. In the US “Base Day” would be a day achieving $5.7 million, while “Base Week” would require a 7-day box office of $100.5 million. These would suggest a core audience was happy to return to cinemas. In Canada “Base Day” would come with a $526,000 single day’s box office and “Base Week” with a $9.8 million gross.
“Material Week” would be achieved in the US with a 7-day box office of $182.5 million. In Canada it would require $17.5 million. This would suggest broader audience comfort with a return to normal attendance.
A true “Recovery Week”, signifying sustained levels of normalcy built off the back of a robust release calendar, would come with the US generating a $232.2 million week and Canada $22.7 million.
Again, each state or province, and cities within them, would have their own markers and this is granular data we are also looking at for the domestic market.
If you have comments or questions about Gower Street’s charts please contact us.
This article was original published in Screendollars’ newsletter #112 (April 13, 2020).