
If only Obi-Wan Kenobi could wave a hand and use the powers of the Jedi to end this crisis or, better still, make it so it never happened. But while movies seen on a big screen can, and will again, offer their audiences such magic the reality in the market is sobering as we close out a Q1 that has been hijacked by the COVID-19 pandemic.
This week Gower Street introduces a new regular report: the Global Box Office Tracker. This report looks at daily figures for 2020 across global markets and compares them against the average figures in each market for the past three years to indicate the current deficit levels we are facing worldwide. This first graph looks at the calendar Q1.
- The stacked bar graph on the left shows total levels split out by domestic, China and international (excluding China).
- The pie chart indicates the current deficit compared to the average of the past three years ($4.7bn) and where (using the same split) those losses are currently coming from.
- The bar graph on the bottom right shows the percentage drops globally, and split out in the same manner, of 2020 compared to the average of the past three years.
This report will run twice weekly in Gower Street’s Road To Recovery report and once each month in Screendollars so that readers can not only track what is happening globally but also see how the make-up of the deficit changes over time.
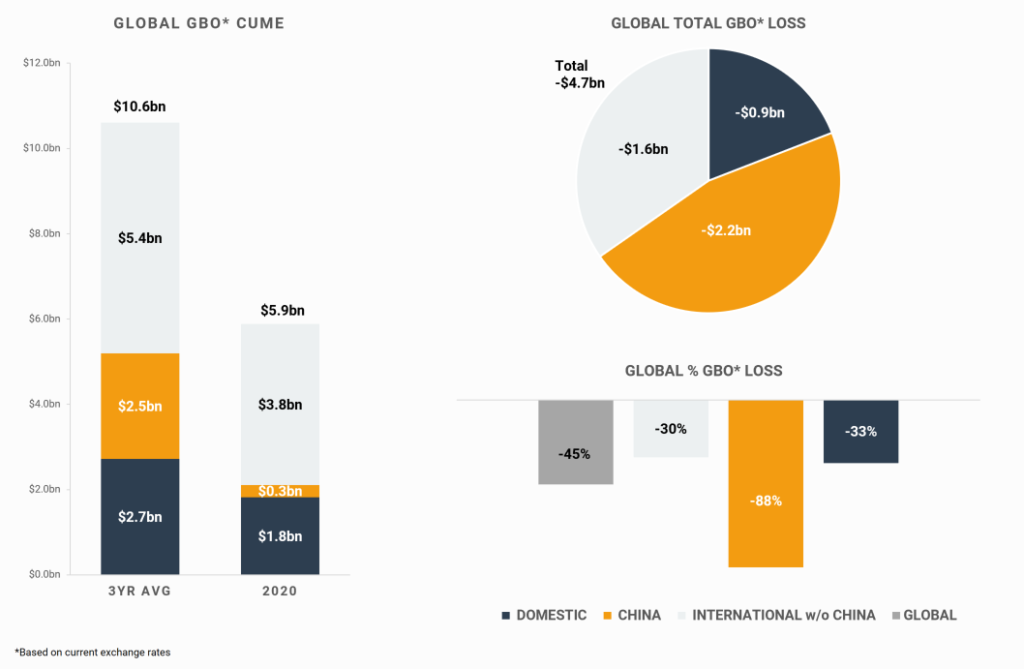
Right now, China understandably accounts for the biggest portion ($2.2bn) of the deficit having closed-down nearly two-months prior to most of the rest of the world and just ahead of one of its two most lucrative box office weeks: the Chinese New Year holiday.
With different markets likely to return to operation at different times we can expect to see the proportions of these graphics shifting over time. Domestic ($0.9bn) and International ($1.6bn excluding China) losses will get worse before they get better. It is hoped, despite a current return to closure, that China may be an early market to resume business.
This hole in our collective business is obviously a concern to us all. Last week we looked at scenarios for where domestic business might plausibly end up based on the current calendar. This week brought a further raft of calendar changes and an indication of what some studios might be thinking.
Some of these moves brought positive clarity with displaced and unset titles such as BLACK WIDOW, MULAN and A QUIET PLACE, PART II selecting new dates. However, as we suggested could happen last week, some moves have displaced other titles where studios have switched out a later-year release for a displaced title and moved it into next year. The shuffle of Marvel Cinematic Universe titles is one such example, with BLACK WIDOW taking ETERNALS’ November date and bumping the following four films on the MCU slate down one release slot. Paramount’s move of TOP GUN: MAVERICK to December displaced THE TOMORROW WAR.
Other titles such as Sony’s GHOSTBUSTERS: AFTERLIFE, Universal’s MINIONS: THE RISE OF GRU and Disney’s JUNGLE CRUISE have joined F9 in eschewing an inevitable 2020 back-end crush in favor of 2021 dates. And many remain unset.
Gower Street now estimates that displaced and currently unset titles have a collective domestic box office value of around $950 million. This is down from $1.56 billion a week ago thanks to the clarity brought by re-dating. However, we now estimate the collective box office for titles reset to 2021, or that have abandoned theatrical ambitions, have a domestic value of around $1.82 billion.
To return to STAR WARS parlance, a new hope may have emerged in recent re-dating moves that theaters could be re-opened by July – WONDER WOMAN 1984’s move to mid-August would allow for a 6-week marketing run-in if theaters were operating by the start of July after a 3-month closure; Disney’s re-set of MULAN for July 24 suggests a similar hope. Of course, this is a fluid situation: further moves may come; some chosen re-set dates could move again.
Gower Street is tracking changes at an even more granular level than shown on the above graph, with international market by market and regional data being introduced to its Road To Recovery report published twice weekly on its new website.
The Road To Recovery report also tracks the number of cinemas open in each market and the volume of daily business alongside other key factors and market-status commentary so we can not only see what has happened and where we stand but also spot first signs of improvement and identify recovery patterns that could provide a blueprint for other markets. A state by state domestic report will also follow.
This article was original published in Screendollars’ newsletter #111 (April 6, 2020)