
Almost a year has passed from when the number of movie theaters operating in North America started to sink significantly due to the COVID-19 crisis. Nearly a quarter (23%) of all US movie theaters have stayed closed since March 2020! These locations generated a combined yearly box office of $1.8 billion on average in 2018 and 2019.
Over the March 13-15 weekend in 2020 most theatres were still open, but the threat of COVID-19 was already causing the lowest three-day weekend result since September 2000. March 15 saw closure orders in New York City and Los Angeles. Within two days less than 40% of domestic theatres were operating. A week later it was under 4%, before hitting rock bottom in April with 1%. This number started to improve slowly from the end of May up to 19% of movie theaters open by market share in mid-august. The re-opening accelerated from that point in the build up to the release of TENET on September 3, when 56% of movie theaters by market share were open. This positive trend peaked at the end of the month with 61%. It stayed there for just two weeks before the triangle-of-troubles: Lack of Product / Re-closing of movie theaters / New or further rise in COVID-19 cases put the brakes on recovery. By the end of the year the number of movie theaters open by market share had fallen to 38%.
Since the beginning of 2021 the situation has improved slightly. A slow re-opening, up to 43% as of the middle of February, has taken place.
Although less than half of all US movie theaters are currently open, most have at least taken the chance to re-open once or more after being forced to close last year. However, many have never re-opened their doors to audiences since they turned out the lights in their auditoriums in March 2020. To understand the structure of closure and re-opening Gower Street Analytics utilized data from our partners at Comscore. Of the 5,253 movie theaters they tracked across the US in 2020, we took the last reported day of each individual cinema as most recent day of operation.
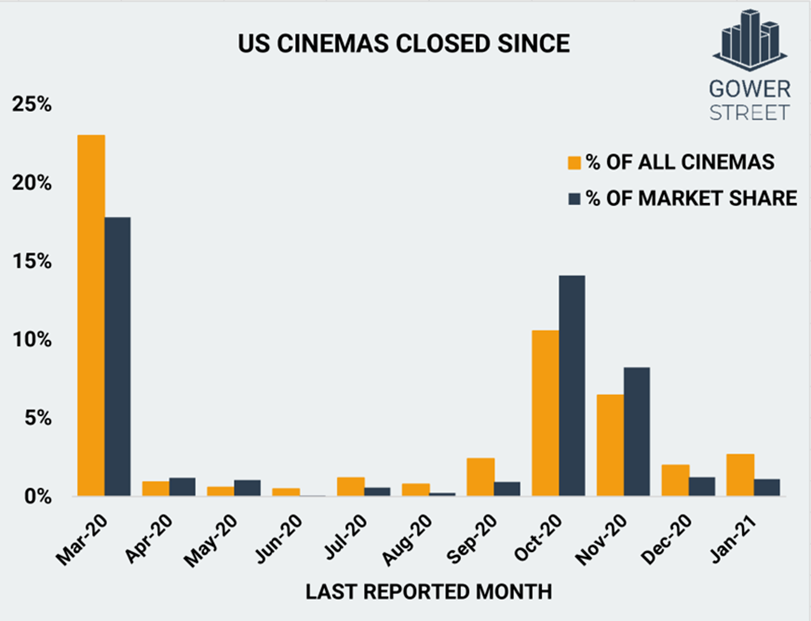
The movie theaters that haven’t re-opened in the last 11 months were, in general, lower grossing locations. While the 1,210 movie theaters that last reported in March 2020 are 23% of all tracked US movie theaters, they represent just 18% of the market share. In contrast the locations currently open in February are 42% of the tracked US movie theaters representing 43% of the market share, thus slightly over-indexing in box office performance.
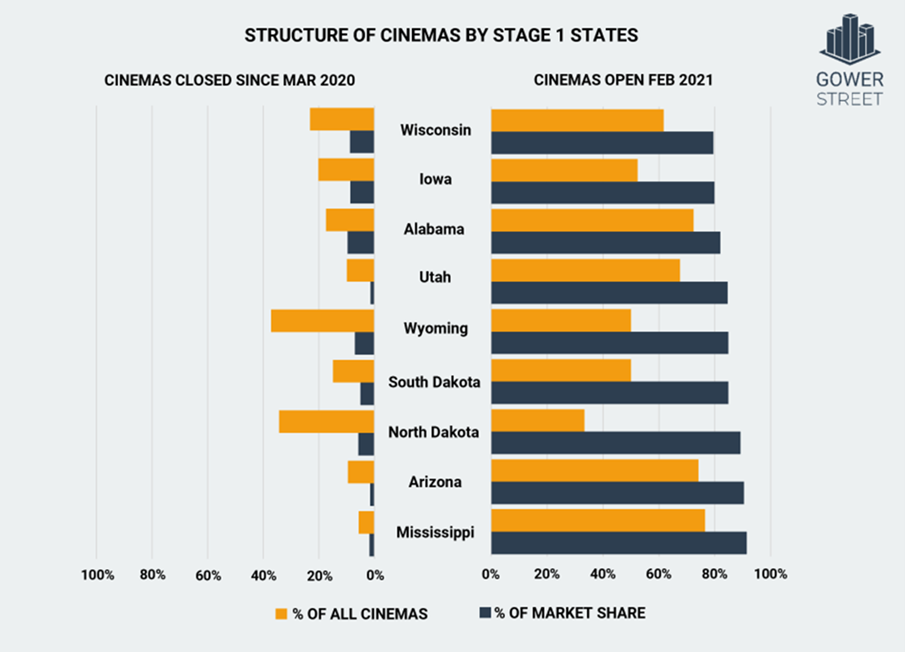
This observation is even more visible within the nine US states that already reached a significant majority, 80% by market share, of movie theaters in operation. This represents Stage 1 of Gower Streets Blueprint To Recovery, a base from which to build on. As of February 22, the following states are at or above this level: Alabama, Arizona, Iowa, Mississippi, North Dakota, South Dakota, Utah, Wisconsin and Wyoming. In each of these nine US states the market share of the movie theaters closed since March is significantly lower than the percentage of total locations those theaters represent in the state. At the same time, the market share of theaters currently open in these states outstrips the percentage of total locations represented by double digit percentage points.
The graph below highlights these in detail, with the state’s market share of theaters in dark blue and the percentage of physical locations across the state in orange. On the left, for the movie theaters closed continuously since March, all orange bars are clearly bigger than the dark blue bars. This is opposite among movie theaters currently open, displayed on the right.
The described disparate allocation of the market share of open theaters and percentage of physical sites operating correlates with the number of screens these locations have. The movie theaters that were closed for the last 11 months entirely generally have a lower number of screens. In fact, more than half of them (55%) have five or fewer screens. This is significantly higher than the norm (42%) of all movie theaters in the US. Of the movie theaters currently open only 32% have five or fewer screens.
Looking at the nine states already at Stage 1 of their Blueprint To Recovery, this phenomenon is even more clear. Movie theaters with less than five screens represent 75% of the locations that have remained closed since March across all these states, while the average among all theatres there is just 52%. Of the current open houses, only 39% have five or fewer screens. Single screen theaters are especially evident amongst the share of the long-closed movie theaters. They account for half of all movie theaters in these nine states that have not opened since March 2020!
Based on this data, it is evident that primarily the lower grossing movie theaters and the ones with fewer screens are those that have not operated at any point since the pandemic forced them to close. Given the restrictions and security measures in place movie theaters with more screens often have a wider range of tools to maintain their business. Moreover, movie theaters that even in pre-pandemic times were generating box office at the lower end of the range, find it even more challenging to achieve a critical amount to make an opening worth trying with the limited supply of attractive content.
When the pandemic fades and the market moves ahead on the road to recovery it will be noteworthy to see how many of the longest closed movie theaters will turn on the lights again. Some have already had to close permanently, such as Charlotte, North Carolina’s oldest movie theater the Regal Manor Twin, which had been in operation since 1947. Let’s hope most of those yet to re-open will have the resources to return, adapt to market challenges and flourish when they are able to do so.
This article was originally published in Screendollars’ newsletter #157 (March 1, 2021).