
Gower Street has added multiple new features to its Road To Recovery reports to help readers to track what is happening locally, regionally and globally.
Regular subscribers will know we have long-featured a summary grid tracking current year business against an average of the three pre-pandemic years (2017-2019) in both our International report (which shows results for 44 individual territories) and our Domestic report (which shows results for all 50 states). Both reports, which utilize data from our partners at Comscore Movies, also track the global and regional totals and compare them to the three-year average. We have also now added a second summary grid which displays the box office comparison for 2021 against 2020.
These summary grids run side-by-side with the three-year average comparison in both the International and Domestic Road To Recovery Reports. This makes comparison and contrast all the more simple.
For instance, a glance at last week’s Road To Recovery report (published July 13 with figures to July 10), showed that while global box office ($8.86bn in 2021 to July 10) was tracking 60% behind the average of the three pre-pandemic years, it was also tracking 41% ahead of 2020. Multiple markets are tracking ahead of 2020, including China, Japan, Australia, New Zealand, Hong Kong, Singapore, Taiwan, Russia, UAE and a number of smaller Central American countries. Among US states, Utah moved ahead of 2020 for the first time in the week to July 10. Several others were poised to do so thanks to the opening of BLACK WIDOW. In comparison only China has managed to overtake the three-year average at some point in the year to date, although it is currently running 8% behind the three-year average.
Each market-view page has been redesigned and now includes two new graphs to replace previous graphs. The first new graph on each page (for each market in the International report and all 50 US states, Washington D.C. and 12 Canadian provinces in the Domestic report) tracks play-week box office against the percentage of cinemas open in the market while also displaying how each play-week performed on Gower Street’s Blueprint To Recovery.
Stages 3-5 on our Blueprint To Recovery are how we measure recovery achievements. Stage 3 measures a week performing at a level equivalent to the lowest grossing week of 2018-2019; Stage 4, one performing at a level equivalent to the median week of 2018-2019; and Stage 5 a play-week performing at a level equivalent to a top quartile play-week of 2018-2019. However, it is important not only to track whether a market achieves these stages but also if they are able to sustain them, especially with territories re-closing and essentially having to start their recovery process over again, sometimes multiple times.
For example, the below sample of this new graphic is for Taiwan. The percentage of cinemas open is shown via the shaded area. The play-weeks show that Taiwan, which never closed down in 2020, hit Stage 4 levels in late August/early September for the first time since the pandemic began and went on to achieve Stage 5 in the April 2 play-week earlier this week – one of only 5 territories to have achieved Stage 5. However, cinemas were forced to close for the first time in mid-May – evident on the graph – so Taiwan has had to begin its road to recovery from scratch, re-opening last Tuesday (July 13).
![]()
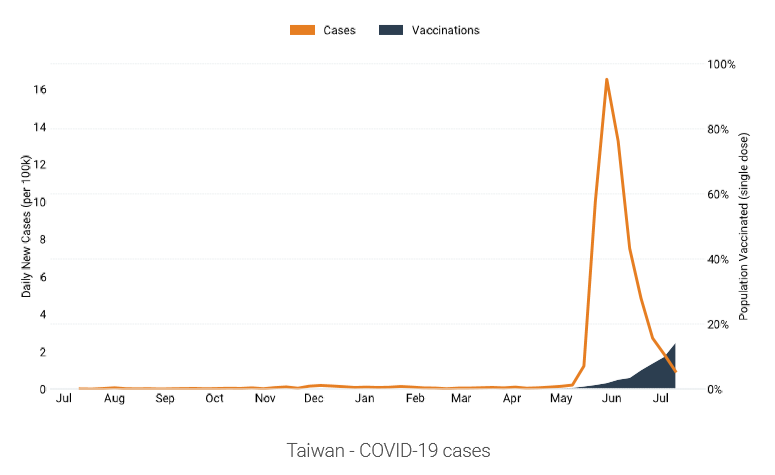
The second new graph on the market-view pages replaces our previous Covid-19 cases graph with one that tracks both cases and first-dose vaccinations, as per data from John Hopkins University.
Sticking with Taiwan as our example, the below sample of this new graphic, when used in comparison to the previous graph (above), clearly shows the surge in Covid-19 cases that caused the shut down in cinemas. These graphs run side-by-side in the Road To Recovery reports. The Covid cases/vaccinations graph is available for 30 global markets and all 50 US states and Washington D.C. Currently pages for Canadian provinces still display the previous, cases tracker, graphic due to a lack of reliable vaccinations data (we hope to update this in due course).
These new features will continue to help our readers to track everything that is happening around the world and to better understand how recovery is progressing locally, regionally and globally.
Our Road To Recovery reports are published weekly each Tuesday and are available via subscription here.
For enquiries contact us here.